Me and my team have had really nice experience with redash to visualize what is going on in our tsdb/postgres databases. In the past we have used grafana for some things, but it never got really into use while most of the team felt it is too complicated. Now people are pushing all the time new graphs and stats about our system and they seem to really love this new tool.
Disclaimer: I have nothing to do with redash and I don’t have any problems with grafana, it just happened to be a tool that we used before.
We have redash running on our cloud where it can connect to all the databases we want (there are a lot of options). Team members create queries and visualizations which are shown in dashboards that can be shared with everyone. I’m sure that we would have been able to do all this with grafana as well, but not in this short time.
We got more done with redash in a week than what we have done with grafana in last 2 years 
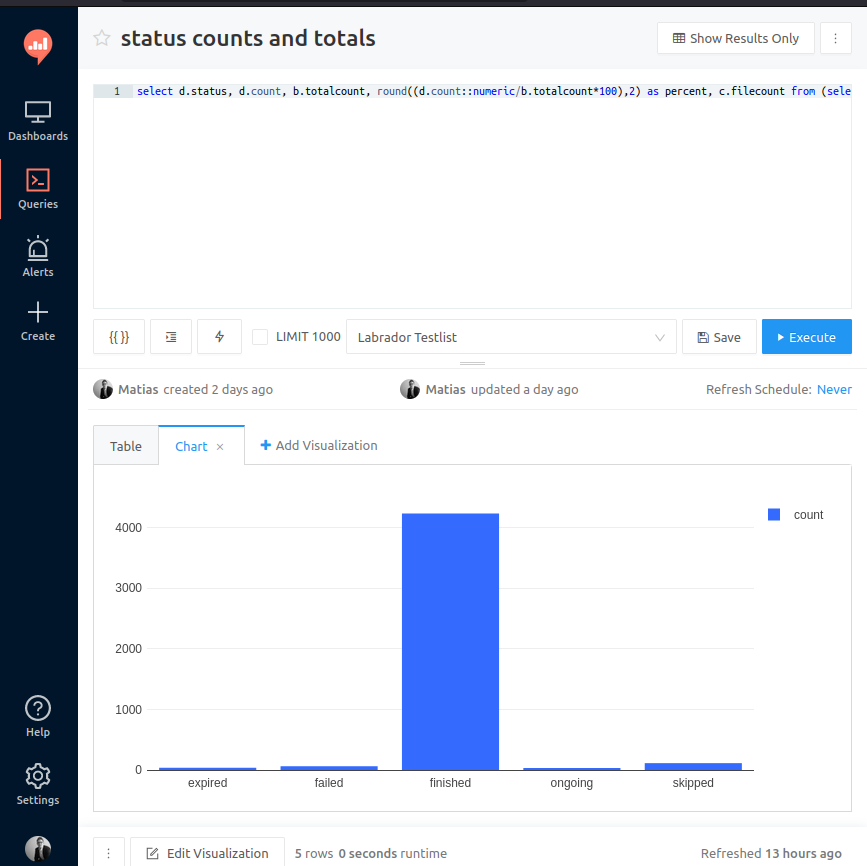
Here’s an example image without giving too many secrets away!
It takes some time to get used to UI while there is so much buttons on every side to do things…  Anyhow, if you have a need for visualizations this tool could be worthwhile reviewing.