We have a microservice, which is continuously inserting data in our Timescale database. This increases our database disk size (pvc size, as we have hosted our application in cloud using Kubernetes) continuously, which is absolutely fine. But along with that, it is increasing our database pod memory also. What could be the reason for that?
Hi @skarcoder, can you bring more details?
There’s no memory leakage bugs open at the moment. Nothing I can remember.
what version of Timescale, what features are you using. Can you replicate the issue and bring a full scenario that we can observe?
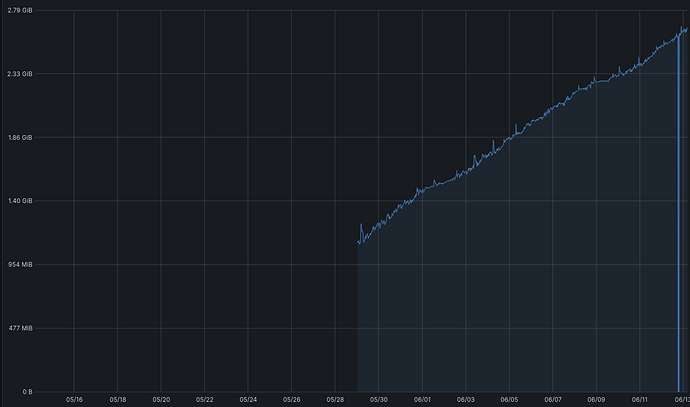
i’m having the same problem over the last 6 month, i tried changing rate of insert , optimizing my queries, nothing so magical is happening, i’m just using queries in the doc to create ohlcs, i don’t even load many data since i just query the minimum (like i create 1D candles from 2 12H candles which is not a big deal) but anyways inserting ticks into my db make it grow until it just fill the entire ram, it seems there’s nothing as garbage collecting or freeing memory. i read somewhere that using time_bucket is the cause but i haven’t tried that.
noting that i’m using dockerized version from image “timescale/timescaledb-ha:pg14-latest”
this grafana report over the last 30 days
grafana report
any tips?
EDIT:
this is one example query:
SELECT
				time_bucket_gapfill('15 seconds', time) AS ts,
				symbol,
				locf(max(bid)) AS high,
				locf(first(bid, time)) AS open,
				locf(last(bid, time)) AS close,
				locf(min(bid)) AS low
			FROM ticks
			WHERE time > now() - INTERVAL '1 second' * 90 AND time < now()
			GROUP BY ts, symbol
			ORDER BY ts, symbol;
and bulk insert this result into another timescaledb which is not like this
i am also wrting each tick received so there is no queue or anything for that which might not be the issue but worth noting
