Hi,
We are using TimescaleDB 2.14.2 on PostgreSQL 14.
We are currently executing load tests with an emulator that emulates the expected load.
Our data load is very write-heavy. There are multiple threads writing to the same table.
Rows to be inserted are partitioned into batches of 1000 rows which are then processed by 16 worker threads which call functions which contain most of the DAL logic. Before a record is inserted, the logic has to check if the record already exists or not, based on that it performs insert or update, etc.
Every inserted row is updated twice more or less immediately after insert which produces a lot of bloat (dead tuples that need to be cleaned up by the vacuum process).
Our hypertable:
CREATE TABLE IF NOT EXISTS dbo.result_double (
               mprt_fk INTEGER NOT NULL,
               result_timestamp TIMESTAMPTZ NOT NULL,
               result_value DOUBLE PRECISION NOT NULL,
               status INTEGER NOT NULL,
               CONSTRAINT pk_result_double PRIMARY KEY (mprt_fk, result_timestamp)
    );

SELECT create_hypertable('dbo.result_double', 'result_timestamp', chunk_time_interval => interval '1 week', if_not_exists => TRUE);

ALTER TABLE dbo.result_double SET (timescaledb.compress, timescaledb.compress_orderby = 'result_timestamp DESC', timescaledb.compress_segmentby = 'mprt_fk');

-- auto compression is disabled, chunks are compressed manually
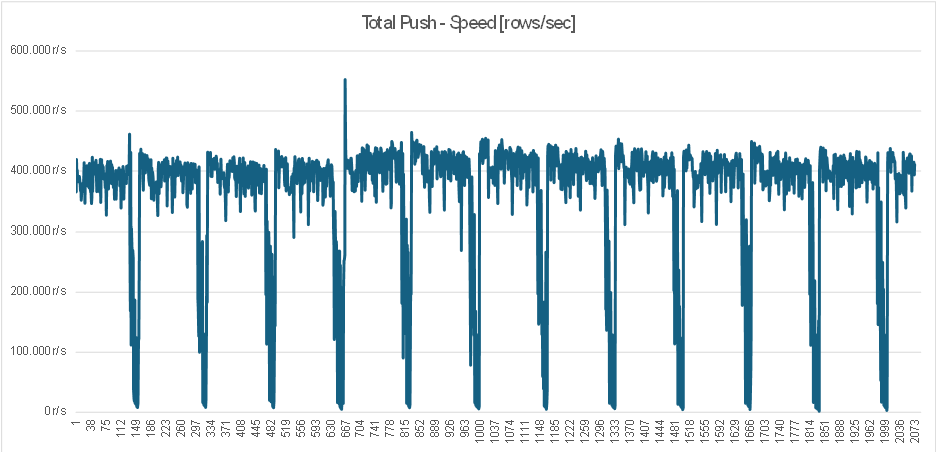
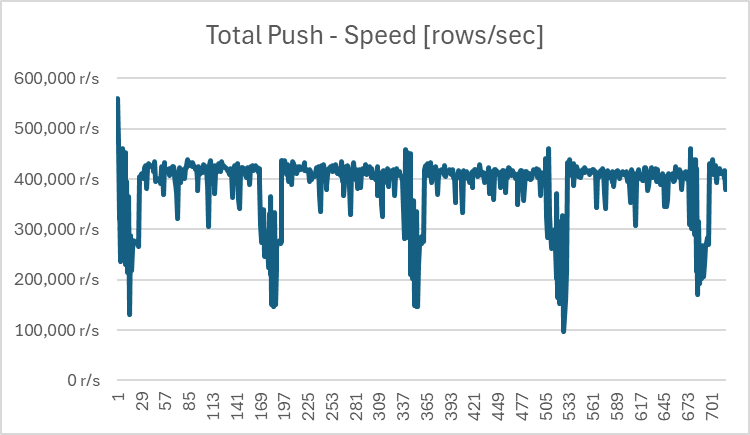
If i leave the load test running for a while I can see the ingestion speed is generally stable (between 300k - 400k write ops/sec), however, when the chunk is full and ingestion into the new chunk starts the performance always drops significantly but then after some time it gets back to normal. On the chart below this pattern is clearly visible (12 chunks).
The problem is somehow related to the autovacuum process, because if I disable it, those performance drops on the beginning of new chunks are no longer visible.
After some analysis I found out that when the performance drops happens the explain plan of one of the functions (which checks if the results already exist in the database) looks differently and contains “Materialize” and “Index Scan Backward” steps which is strange. Below are explain plans (in_results array has 1000 elements, i deleted logged parameters to make is shorter):
WHEN SLOW (beginning of chunk):
2024-07-28 17:57:03.479 CEST [1137484] postgres@tsdb1 LOG:  duration: 41.536 ms  plan:
        Query Text: SELECT
                r_new.mprt_fk,
                r_new.result_timestamp,
                r_new.result_value AS new_result_value,
                r_new.status AS new_status,
                r_old.result_value AS old_result_value,
                r_old.status AS old_status
            FROM unnest(in_results) AS r_new
            LEFT JOIN dbo.result_double AS r_old ON (
                r_new.mprt_fk = r_old.mprt_fk AND
                r_new.result_timestamp = r_old.result_timestamp AND
                        -- To make chunk pruning work
                r_old.result_timestamp >= min_result_timestamp AND r_old.result_timestamp <= max_result_timestamp
            )
                WHERE (x'70000000'::INTEGER & r_new.status = 0)
        Nested Loop Left Join  (cost=0.56..17.88 rows=5 width=36) (actual time=0.039..41.447 rows=1000 loops=1)
          Output: r_new.mprt_fk, r_new.result_timestamp, r_new.result_value, r_new.status, r_old.result_value, r_old.status
          Inner Unique: true
          Join Filter: ((r_new.mprt_fk = r_old.mprt_fk) AND (r_new.result_timestamp = r_old.result_timestamp))
          Rows Removed by Join Filter: 499500
          Buffers: shared hit=2005
          ->  Function Scan on pg_catalog.unnest r_new  (cost=0.00..15.00 rows=5 width=24) (actual time=0.028..0.108 rows=1000 loops=1)
                Output: r_new.mprt_fk, r_new.result_timestamp, r_new.result_value, r_new.status
                Function Call: unnest('{"(deleted_params_to_make_it_shorter)"}'::dbo.result_double_udt[])
                Filter: ((1879048192 & r_new.status) = 0)
          ->  Materialize  (cost=0.56..2.79 rows=1 width=24) (actual time=0.000..0.015 rows=500 loops=1000)
                Output: r_old.result_value, r_old.status, r_old.mprt_fk, r_old.result_timestamp
                Buffers: shared hit=2005
                ->  Index Scan Backward using _hyper_102_241_chunk_result_double_result_timestamp_idx on _timescaledb_internal._hyper_102_241_chunk r_old  (cost=0.56..2.78 rows=1 width=24) (actual time=0.008..0.384 rows=1000 loops=1)
                      Output: r_old.result_value, r_old.status, r_old.mprt_fk, r_old.result_timestamp
                      Index Cond: ((r_old.result_timestamp >= '2023-05-22 15:00:00+02'::timestamp with time zone) AND (r_old.result_timestamp <= '2023-05-22 15:16:39+02'::timestamp with time zone))
                      Buffers: shared hit=2005
2024-07-28 17:57:03.479 CEST [1137484] postgres@tsdb1 CONTEXT:  SQL statement "SELECT
                r_new.mprt_fk,
                r_new.result_timestamp,
                r_new.result_value AS new_result_value,
                r_new.status AS new_status,
                r_old.result_value AS old_result_value,
                r_old.status AS old_status
            FROM unnest(in_results) AS r_new
            LEFT JOIN dbo.result_double AS r_old ON (
                r_new.mprt_fk = r_old.mprt_fk AND
                r_new.result_timestamp = r_old.result_timestamp AND
                        -- To make chunk pruning work
                r_old.result_timestamp >= min_result_timestamp AND r_old.result_timestamp <= max_result_timestamp
            )
                WHERE (x'70000000'::INTEGER & r_new.status = 0)"
        PL/pgSQL function dbo.res_fill_temp_double(dbo.result_double_udt[]) line 11 at RETURN QUERY
WHEN FAST:
2024-07-28 18:00:42.355 CEST [1137484] postgres@tsdb1 LOG:  duration: 2.902 ms  plan:
        Query Text: SELECT
                r_new.mprt_fk,
                r_new.result_timestamp,
                r_new.result_value AS new_result_value,
                r_new.status AS new_status,
                r_old.result_value AS old_result_value,
                r_old.status AS old_status
            FROM unnest(in_results) AS r_new
            LEFT JOIN dbo.result_double AS r_old ON (
                r_new.mprt_fk = r_old.mprt_fk AND
                r_new.result_timestamp = r_old.result_timestamp AND
                        -- To make chunk pruning work
                r_old.result_timestamp >= min_result_timestamp AND r_old.result_timestamp <= max_result_timestamp
            )
                WHERE (x'70000000'::INTEGER & r_new.status = 0)
        Nested Loop Left Join  (cost=0.57..29.03 rows=5 width=36) (actual time=0.092..2.665 rows=1000 loops=1)
          Output: r_new.mprt_fk, r_new.result_timestamp, r_new.result_value, r_new.status, r_old.result_value, r_old.status
          Inner Unique: true
          Buffers: shared hit=4000
          ->  Function Scan on pg_catalog.unnest r_new  (cost=0.00..15.00 rows=5 width=24) (actual time=0.071..0.233 rows=1000 loops=1)
                Output: r_new.mprt_fk, r_new.result_timestamp, r_new.result_value, r_new.status
                Function Call: unnest('{"(deleted_params_to_make_it_shorter)"}'::dbo.result_double_udt[])
                Filter: ((1879048192 & r_new.status) = 0)
          ->  Index Scan using "240_229_pk_result_double" on _timescaledb_internal._hyper_102_240_chunk r_old  (cost=0.57..2.79 rows=1 width=24) (actual time=0.002..0.002 rows=0 loops=1000)
                Output: r_old.result_value, r_old.status, r_old.mprt_fk, r_old.result_timestamp
                Index Cond: ((r_old.mprt_fk = r_new.mprt_fk) AND (r_old.result_timestamp = r_new.result_timestamp) AND (r_old.result_timestamp >= '2023-05-15 15:00:00+02'::timestamp with time zone) AND (r_old.result_timestamp <= '2023-05-15 15:16:39+02'::timestamp with time zone))
                Buffers: shared hit=4000
2024-07-28 18:00:42.355 CEST [1137484] postgres@tsdb1 CONTEXT:  SQL statement "SELECT
                r_new.mprt_fk,
                r_new.result_timestamp,
                r_new.result_value AS new_result_value,
                r_new.status AS new_status,
                r_old.result_value AS old_result_value,
                r_old.status AS old_status
            FROM unnest(in_results) AS r_new
            LEFT JOIN dbo.result_double AS r_old ON (
                r_new.mprt_fk = r_old.mprt_fk AND
                r_new.result_timestamp = r_old.result_timestamp AND
                        -- To make chunk pruning work
                r_old.result_timestamp >= min_result_timestamp AND r_old.result_timestamp <= max_result_timestamp
            )
                WHERE (x'70000000'::INTEGER & r_new.status = 0)"
        PL/pgSQL function dbo.res_fill_temp_double(dbo.result_double_udt[]) line 11 at RETURN QUERY
On the beggining i was using the default autovacuum settings. Then I changed the following values, but the result is still the same:
- CHANGED autovacuum_vacuum_scale_factor FROM 0.2 to 0.01
- CHANGED autovacuum_cost_limit from -1 to 10000
- CHANGED autovacuum_cost_delay from -1 to 0
Could someone please help me understand why this is happening? And how to solve this issue?
Any help or insights you can provide on this issue would be greatly appreciated. Thank you in advance for your support and guidance!

