Hello,
I have a docker swarm architecture, where 2 different database service is running.
One is TimescaleDB HA Service with 3 Patroni Cluster and 3 ETCD Cluster, one-one container deployed on each node. Another is PostgreSQL HA Service with 2 nodes of Repmgr deployed on each node respectively.
Version Details for TimescaleDB Service:
PostgreSQL: 13.8
TimescaleDB: 2.7.1
Installation Method: Docker(timescale/timescaledb-ha:pg13.7-ts-2.7.1-latest)
Setup: 3 Node of Patroni-HA - ETCD and one PgPool using Docker Swarm.
Version Details for PostgreSQL Service:
PostgreSQL Version: 12.4
Installation Method: Docker(bitnami/postgresql-repmgr:12)
Setup: 2 Node of Repmgr and one PgPool using Docker Swarm.

Issue:
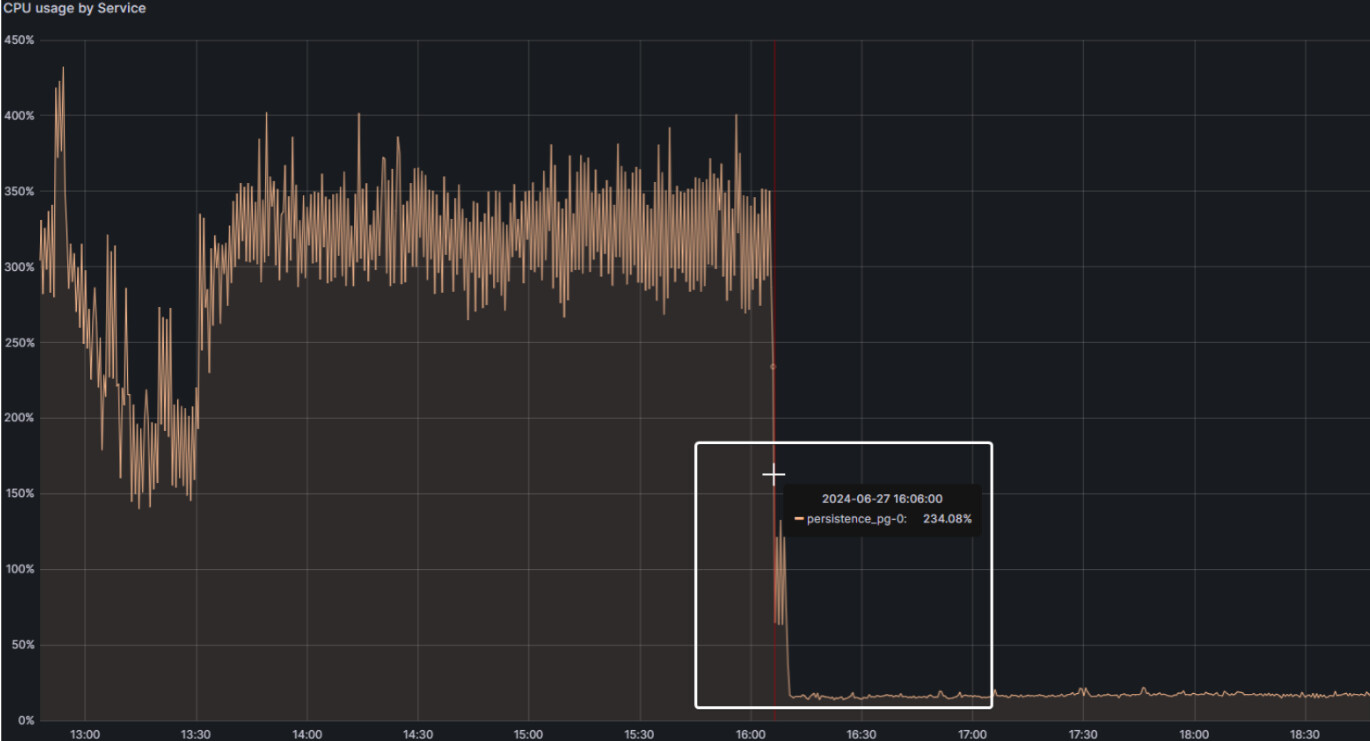
There was high CPU Usage in Node-1 which was increasing consistently. On checking specifically for service consuming more CPU, it was observed that it was consumed by PostgreSQL Service.
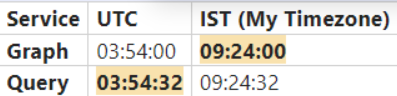
Then I fetched the connections stats in database, there I found 5 sessions of idle in transaction. And all 5 sessions had same query. Whose state_change time was matching approximately with the time of increase in CPU Usage of PostgreSQL docker service in grafana graph. So I concluded, these 5 sessions were the reason behind cpu consumption. But when I checked the status of resource consumption using process (ps aux | grep postgres) command and top command. In both cases, idle in transaction sessions cpu consumption was 0%.

Sample ps aux details which I ran inside the postgresql docker container:
USER PID %CPU %MEM VSZ RSS TTY STAT START TIME COMMAND
1001 25202 0.0 0.0 2255512 13584 ? Ss Jun21 0:00 postgres: postgres postgres 10.10.1.195(33692) idle
1001 34045 0.0 0.0 2278996 40328 ? Ss Jun21 0:13 postgres: asm_user tsdb 10.10.1.195(51664) idle
1001 884810 0.0 0.2 2256700 110588 ? Ss Jun26 0:00 postgres: asm_user tsdb 10.10.1.53(50158) idle in transaction
1001 885089 0.0 0.1 2255740 76812 ? Ss Jun26 0:00 postgres: asm_user tsdb 10.10.1.195(59626) idle in transaction
1001 885353 0.0 0.2 2256988 125592 ? Ss Jun26 0:01 postgres: asm_user tsdb 10.10.1.195(49802) idle in transaction
1001 889714 0.0 0.1 2255640 52960 ? Ss Jun26 0:00 postgres: asm_user tsdb 10.10.1.53(57404) idle in transaction
1001 893820 0.0 0.0 2255768 47100 ? Ss Jun26 0:00 postgres: asm_user tsdb 10.10.1.195(47092) idle in transaction
1001 904151 0.0 0.0 2257116 25592 ? Ss Jun26 0:00 postgres: postgres tsdb 10.10.1.195(46746) idle
1001 1078593 0.7 0.1 2275896 65060 ? Ss 05:29 0:29 postgres: asm_user tsdb 10.10.1.53(36738) idle
1001 1084060 0.0 0.1 2256760 96624 ? Ss 06:04 0:00 postgres: asm_user tsdb 10.10.1.53(35812) idle
1001 1084606 0.0 0.0 2255500 17304 ? Ss 06:08 0:00 postgres: asm_user tsdb 10.10.1.53(43742) idle
1001 1084918 9.9 3.4 2267276 1683660 ? Ss 06:10 2:19 postgres: asm_user tsdb 10.10.1.53(43276) idle
1001 1085106 9.3 3.4 2265728 1683328 ? Ss 06:11 2:03 postgres: asm_user tsdb 10.10.1.195(58606) idle
1001 1085123 0.0 0.0 2262752 47592 ? Ss 06:11 0:00 postgres: asm_user tsdb 10.10.1.53(43920) idle
1001 1085579 12.9 3.4 2265652 1668496 ? Ss 06:14 2:27 postgres: asm_user tsdb 10.10.1.195(45850) idle
1001 1085583 0.0 0.0 2255500 17244 ? Ss 06:14 0:00 postgres: asm_user tsdb 10.10.1.195(45868) idle
1001 1085804 0.0 0.0 2255500 17260 ? Ss 06:16 0:00 postgres: asm_user tsdb 10.10.1.53(33508) idle
1001 1085812 14.9 3.3 2264092 1629084 ? Ss 06:16 2:37 postgres: asm_user tsdb 10.10.1.53(33528) idle
1001 1085816 0.0 0.0 2255500 22908 ? Ss 06:16 0:00 postgres: asm_user tsdb 10.10.1.195(40346) idle
Sample result of top command ran inside the postgresql docker container:
PID USER PR NI VIRT RES SHR S %CPU %MEM TIME+ COMMAND
1085106 1001 20 0 2265728 1.6g 1.6g R 63.9 3.4 2:07.26 postgres
1086334 1001 20 0 2263284 1.2g 1.2g R 52.3 2.5 6:27.49 postgres
1086745 1001 20 0 2263412 1.1g 1.1g S 45.7 2.4 3:20.88 postgres
1086426 1001 20 0 2263416 1.5g 1.5g R 35.1 3.2 3:51.12 postgres
1086444 1001 20 0 2263292 1.1g 1.1g R 24.2 2.4 2:22.83 postgres
1085812 1001 20 0 2264092 1.6g 1.6g R 23.2 3.3 2:49.42 postgres
1086337 1001 20 0 2263416 979.7m 977.0m R 22.2 2.0 2:08.84 postgres
1086468 1001 20 0 2263416 1.4g 1.4g R 20.2 3.0 2:37.97 postgres
1086460 1001 20 0 2264260 1.5g 1.5g S 18.2 3.1 1:15.70 postgres
1085579 1001 20 0 2265652 1.6g 1.6g R 13.9 3.4 2:35.56 postgres
1085980 1001 20 0 2263416 914716 911908 R 12.6 1.9 2:02.52 postgres
1086819 1001 20 0 2263308 994216 991636 S 8.3 2.0 1:20.39 postgres
1085710 1001 20 0 2266812 1.5g 1.5g S 6.0 3.3 1:44.21 postgres
1085334 1001 20 0 2256728 300696 298464 S 3.0 0.6 0:18.52 postgres
1085295 1001 20 0 2256448 293596 291516 S 2.6 0.6 0:11.88 postgres
200 1001 20 0 2255668 4444 3856 S 1.7 0.0 450:37.32 postgres
193 1001 20 0 2255652 4392 3792 S 1.3 0.0 460:05.24 postgres
1085392 1001 20 0 2256716 96512 94148 S 0.3 0.2 0:00.32 postgres
1085816 1001 20 0 2255500 22908 21460 S 0.3 0.0 0:00.16 postgres
1085989 1001 20 0 2263932 1.5g 1.5g S 0.3 3.3 2:52.27 postgres
1 1001 20 0 15468 1420 1124 S 0.0 0.0 9:10.56 repmgrd
131 1001 20 0 2254288 31960 31544 S 0.0 0.1 88:03.58 postgres
132 1001 20 0 66048 1496 1308 S 0.0 0.0 0:00.81 postgres
138 1001 20 0 2254540 1.6g 1.6g S 0.0 3.5 7:16.90 postgres
139 1001 20 0 2254516 60196 59820 S 0.0 0.1 1:29.27 postgres
140 1001 20 0 2254288 19028 18692 S 0.0 0.0 5:57.71 postgres
141 1001 20 0 2255124 5784 5224 S 0.0 0.0 1:07.43 postgres
I terminated those session and immediately CPU Usage was back to normal. Which I felt I handled it well and resolved it.
But the main issue occur now:
On reporting this issue to developers, they told that there are 3 different queries in a single transaction, which is executed through an application.
Below I have mentioned the overview of sql queries in order they are executed:
SELECT Query from tsdb_bi.bi_eq_ign (PostgreSQL Service)
SELECT Query from mpr, mte (TimescaleDB Service)
INSERT/UPDATE tsdb_bi.bi_eq_ign_stat (PostgreSQL Service)
According to developers, 1st query is executed successfully, but problem is in 2nd query, that query results from timescaledb are not returned properly. And they are suspecting that there is some problem in infra. Developers suspect that there is a problem with timescaledb’s session or that connection information has been lost.
Please someone help me with a way to identify the actual problem.