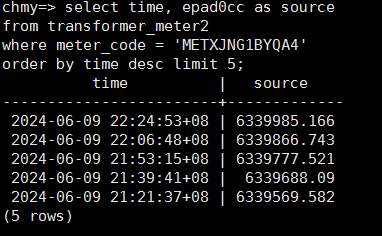
There is a transformer and every 15 minutes the collector automatically records its readings.
Its readings are downsampled to the maximum hourly, daily, monthly, and yearly, respectively.
But it has an incredible number of data on continuous aggregation.
Step 1, the original table
select time, epad0cc
from transformer_meter2
where meter_code = 'METXJNG1BYQA4'
order by time desc limit 5;

We see that the current maximum readings are: 6339985.166
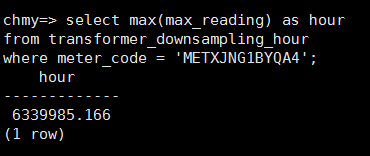
STEP 2, CREATE HOURLY DOWNSAMPLING (HERE I USED THE TIMESCALEDB.MATERIALIZED_ONLY = FALSE PARAMETER)
CREATE MATERIALIZED VIEW TRANSFORMER_DOWNSAMPLING_HOUR
    WITH (TIMESCALEDB.CONTINUOUS,
        TIMESCALEDB.MATERIALIZED_ONLY = FALSE) AS
SELECT TIME_BUCKET('1 hour'::INTERVAL, "time") AS RECODE_TIME,
       METER_CODE,
       MAX(EPAD0CC)                            AS MAX_READING
FROM TRANSFORMER_METER2
GROUP BY TIME_BUCKET('1 hour'::INTERVAL, "time"), METER_CODE;

We see that its data is correct:6339985.166
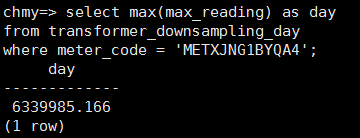
Step 3, create a built-in daily downsampling (create a continuous aggregate on top of another continuous aggregate)
CREATE MATERIALIZED VIEW TRANSFORMER_DOWNSAMPLING_DAY
    WITH (TIMESCALEDB.CONTINUOUS,
        TIMESCALEDB.MATERIALIZED_ONLY = FALSE) AS
SELECT TIME_BUCKET('1 day'::INTERVAL, "recode_time") AS RECODE_TIME,
       METER_CODE,
       MAX(MAX_READING)                              AS MAX_READING
FROM TRANSFORMER_DOWNSAMPLING_HOUR
GROUP BY TIME_BUCKET('1 day'::INTERVAL, "recode_time"), METER_CODE;

Its data is also correct:6339985.166
Step 3, Create a Built-in Monthly Downsampling (Create a Continuous Aggregate on Top of Another Continuous Aggregate)
CREATE MATERIALIZED VIEW TRANSFORMER_DOWNSAMPLING_MTH
    WITH (TIMESCALEDB.CONTINUOUS,
        TIMESCALEDB.MATERIALIZED_ONLY = FALSE) AS
SELECT TIME_BUCKET('1 month'::INTERVAL, "recode_time") AS RECODE_TIME,
       METER_CODE,
       MAX(MAX_READING)                                AS MAX_READING
FROM TRANSFORMER_DOWNSAMPLING_DAY
GROUP BY TIME_BUCKET('1 month'::INTERVAL, "recode_time"), METER_CODE;
The data here confuses me:6329992.613。 I think it should be:6339985.166
Excuse me, what is the reason for this? How should it be resolved?